

Plot Histogram in R:
Method 1: hist(vector, breaks)
Take care for the parameter “breaks”:
according the help:
breaks: a single number giving the number of cells for the histogram.
Important: the number is a suggestion only! The breakpoints will be set to pretty values.
For example:
>data(“women”) #load dateset “women”
> hist(women$weight, breaks = 7)
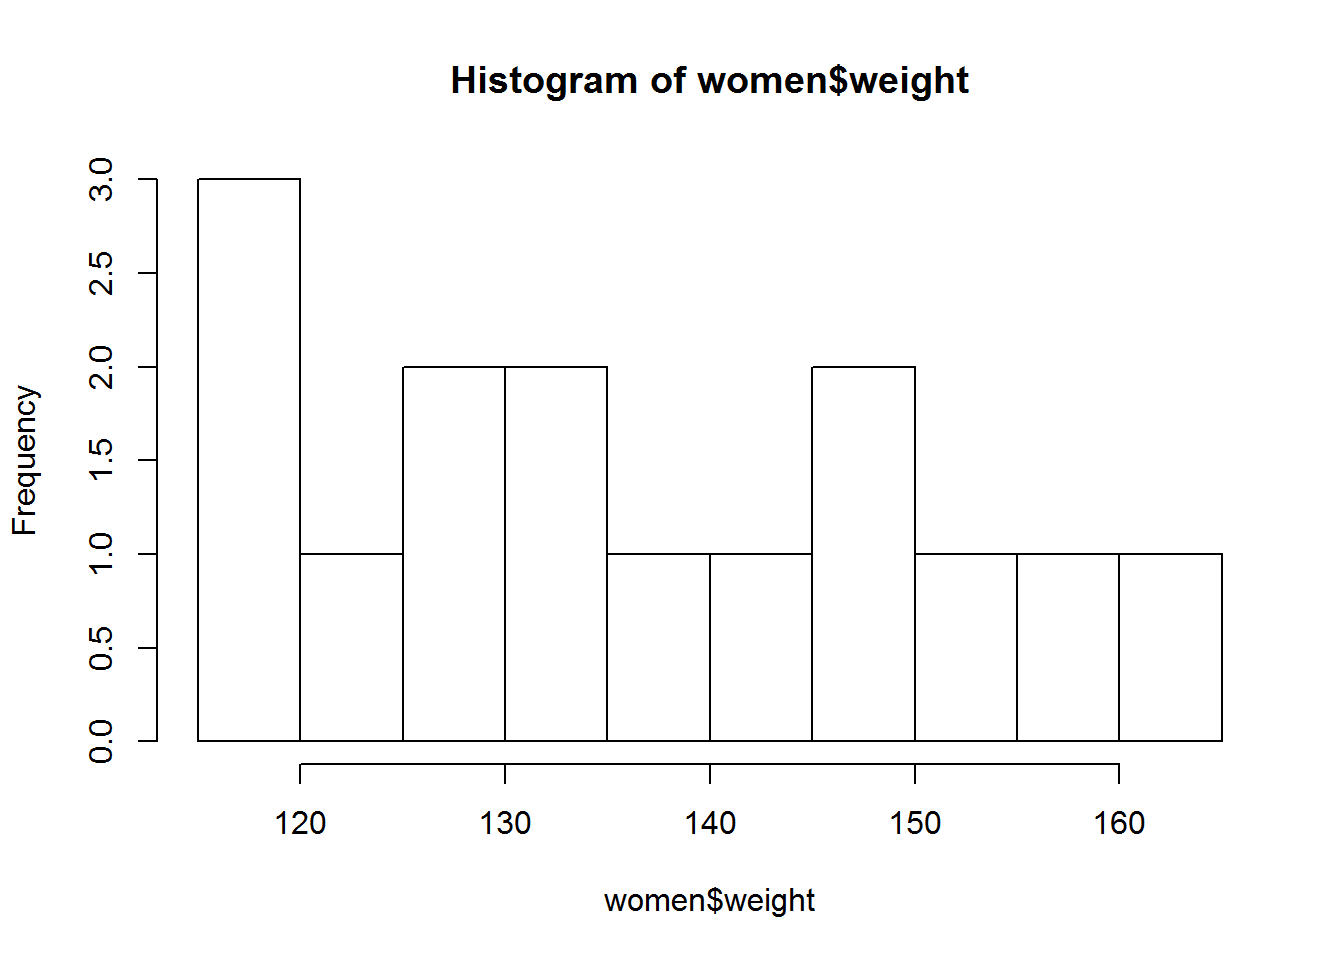
If you want to have exact 7 bins, you should specify the position
>hist(women$weight, breaks=seq(min(women$weight), max(women$weight), l = 7))
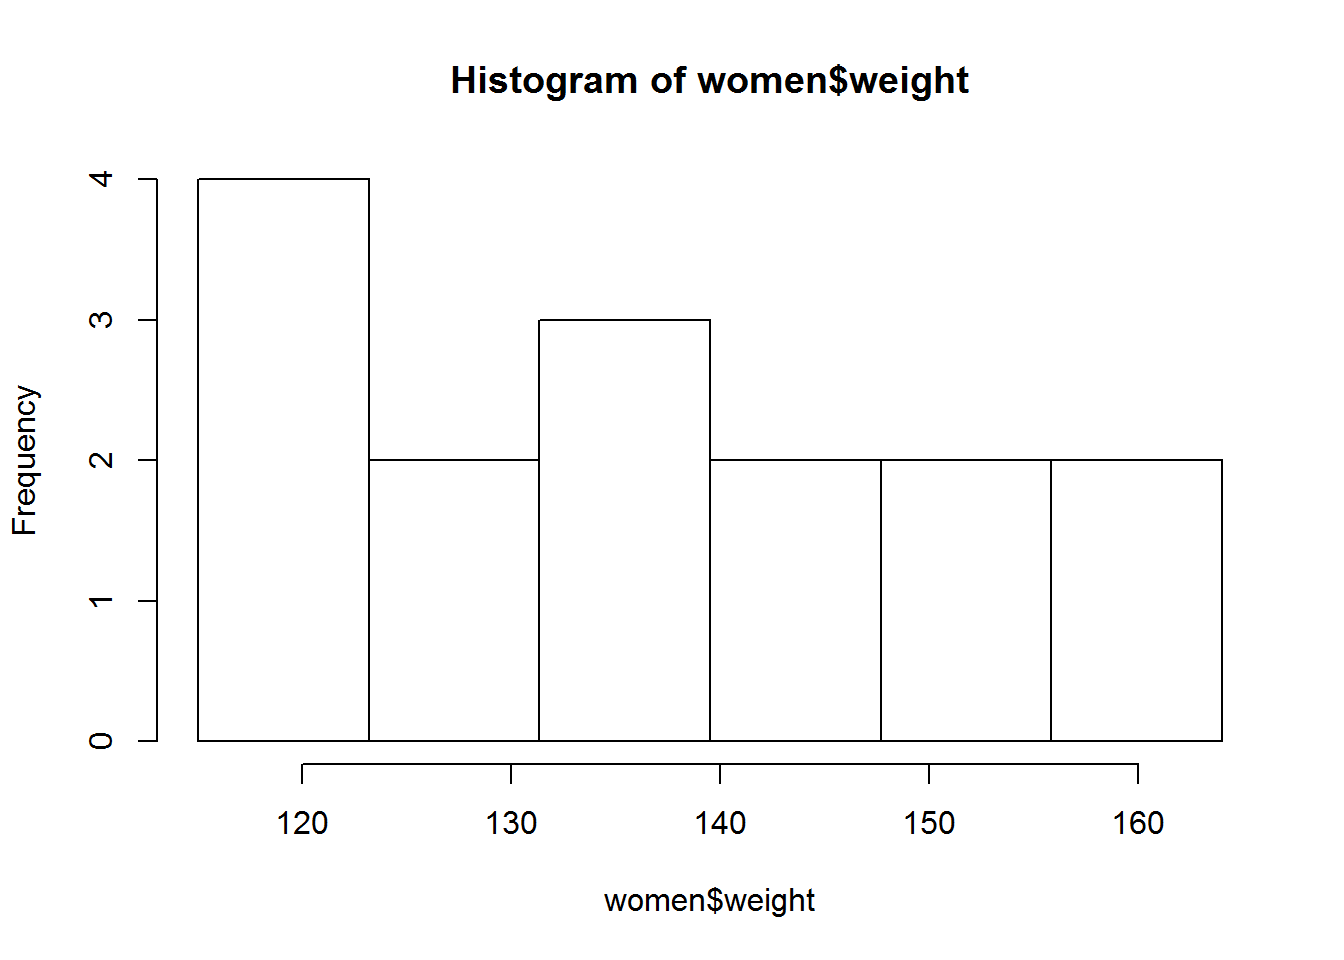
so, you will get the exact 7 bins